📊 VB-MAPP Transitions Assessment & Graphing Dashboard | Excel Template
Streamline your VB-MAPP Transitions Assessment scoring, milestone analysis, and classroom-readiness tracking with this fully automated Excel dashboard. Designed for ABA professionals, this tool simplifies transition scoring, calculates learning style velocity, and creates instant visual reports—without manual calculations.
Perfect for BCBAs, BCaBAs, clinics, consultants, and educators looking for a faster way to manage VB-MAPP transitions data, monitor school-readiness milestones, and demonstrate measurable independence and progress over time.
⚠️ Important Disclaimer: This digital assessment workbook is a scoring and graphing tool designed to streamline data analysis. You will need to have an official, paid version of the VB-MAPP assessment protocol or manual to administer and utilize this tool effectively.
✨ What’s Included (4 Powerful Tabs)
1️⃣ Transitions Assessment Tracker
Complete digital scoring sheet with all 18 official VB-MAPP Transitions Assessment categories preloaded.
Log up to 25 assessments per client to capture long-term developmental growth.
Track assessment dates over time with clean, standardized data entry columns.
Enter scores quickly with dropdown scoring options matching the protocol.
Automatic totals and summaries eliminate math errors entirely.
Conditional formatting highlights critical deficit areas instantly.
Compare baseline vs current scores at a single glance.
Perfect for efficient VB-MAPP transitions assessment scoring in Excel.
2️⃣ One-Time Assessment Dashboard
Select any single assessment date from the dropdown menu to instantly view deep-dive analytics and visual distributions for that specific milestone.
Total Transition Points Summary: Instantly view the student's cumulative score and percentage metrics.
Automated Functional Tier Placement: Dynamically calculates whether the learner falls into Intensive Support, Transitional/Small Group, or Age-Appropriate Independence, complete with a clinical tier definition for educational setting recommendations.
Transition Domain Scores Bar Chart: A comprehensive, 18-category visual breakdown of every single transition domain score at a glance.
Raw & Average Grouping Metrics: Compares the macro-groupings (VB-MAPP Skills, Learning Style, and Independence & Self-Care) by total raw points and 1–5 scale averages.
Total Assessment Score Distribution: A macro-level bar graph showing exactly how many domains fall into each support need category (from Intensive Support to Age-Appropriate Independence).
Granular Score Distribution Charts: Three dedicated donut charts that visually map out support needs specifically for VB-MAPP Skills, Learning Style, and Independence & Self-Care.
Assessment Results Matrix Table: A clean data summary matrix breaking down exact counts, total scores out of 30, and group averages.
Great for parent meetings, IEP development, clinical supervision, and determining classroom placement readiness.
3️⃣ Multiple Assessment Dashboard
The ultimate progress monitoring engine. Track learner progress, growth speed, and mastery timelines across months of treatment.
📈 Advanced Clinical Analytics View:
Total transition score trends mapped out across a historical timeline.
Months in Treatment Card: Automatically calculates exactly how long the learner has been in treatment using exact calendar intervals ($30.4375$-day monthly logic).
Growth Velocity Metrics: Measures net points gained per month across macro-categories.
Projected Months to Mastery: Advanced logic looks at current scores and growth velocity to predict exactly when a learner will reach mastery (30-point ceiling) or flags if programming needs to be reviewed.
🏆 Top 5 Most Improved Domains: Leaderboard showcasing where the learner has made the largest leaps.
⚠️ Top 5 Priority Deficits: Ascending leaderboard highlighting the lowest scores that require immediate programming shifts.
Ideal for showing measurable gains in independence, learning styles, and classroom readiness.
4️⃣ Easy Setup Tab
Customize configuration labels to fit your clinical workflow.
💡 Why You’ll Love It
Saves hours on manual scoring and dual data entry.
Instantly calculates treatment velocity and mastery projections for smarter programming.
Professional, dynamic graphs ready to paste straight into progress reports.
Clean, organized learner data all contained in one high-performance file.
Built for real-world ABA clinical use and intensive transition planning.
No formulas or setup required—just paste your scores and go.
👩🏫 Perfect For
BCBAs • BCaBAs • ABA Clinics • Program Consultants • Special Education Teachers

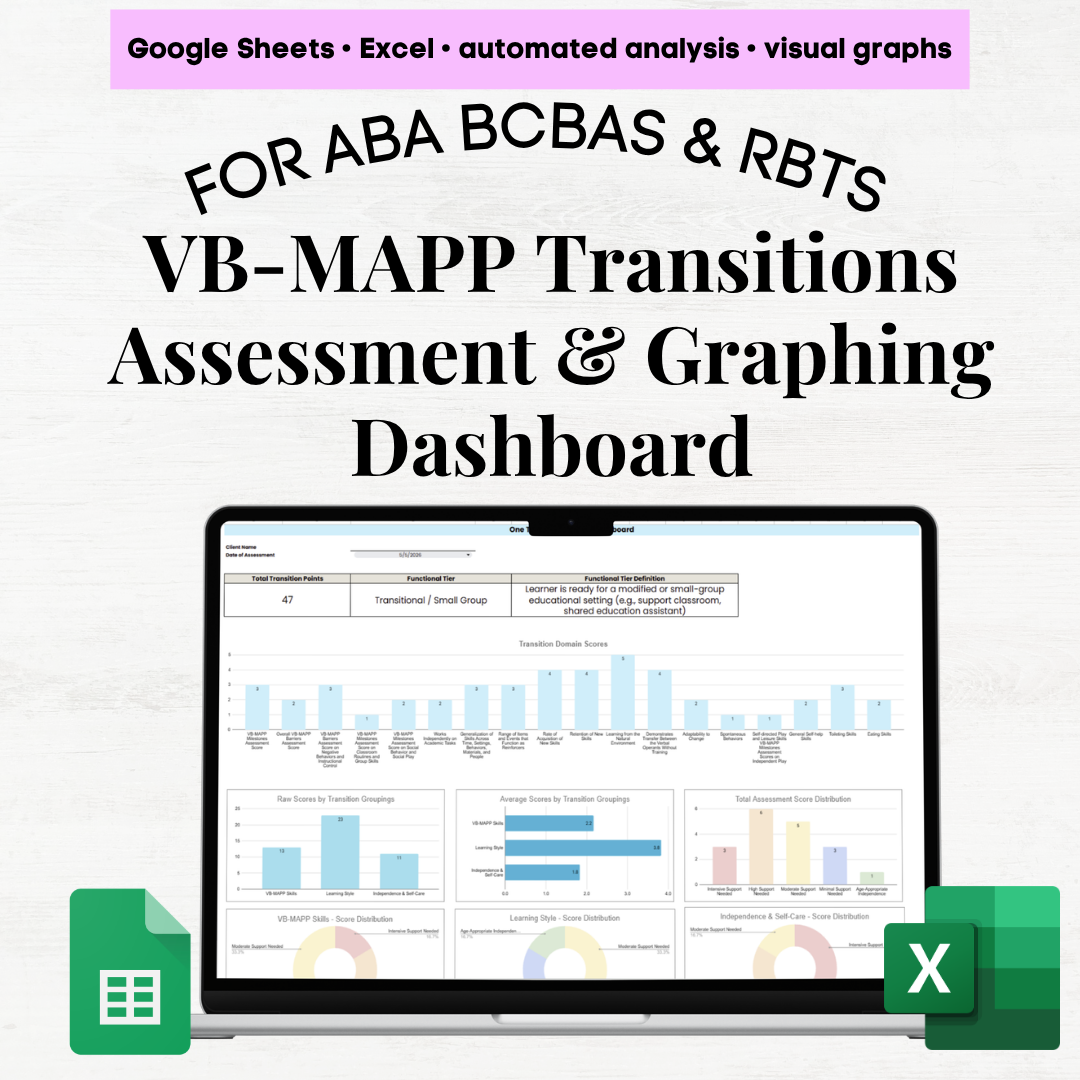 Image 1 of 10
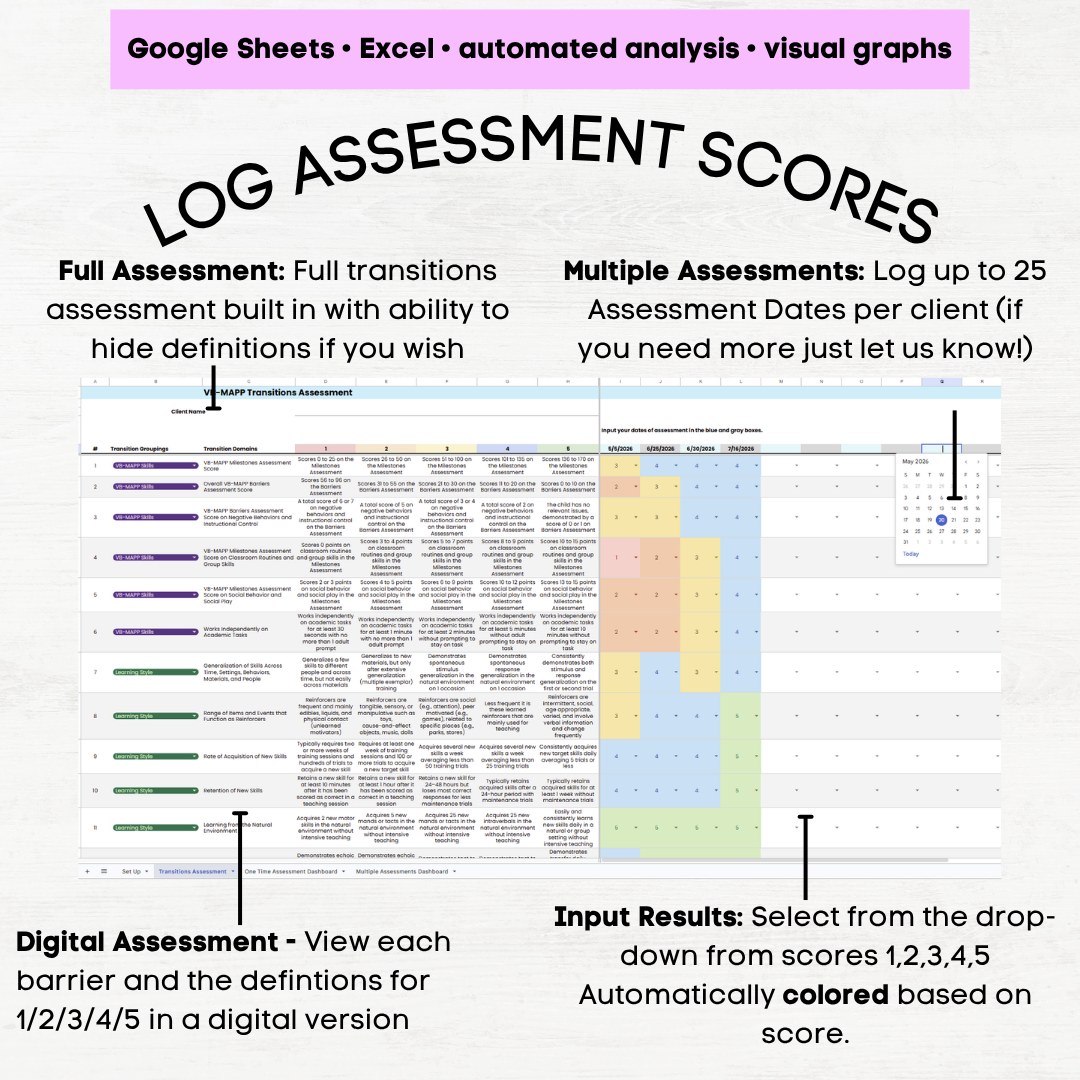 Image 2 of 10
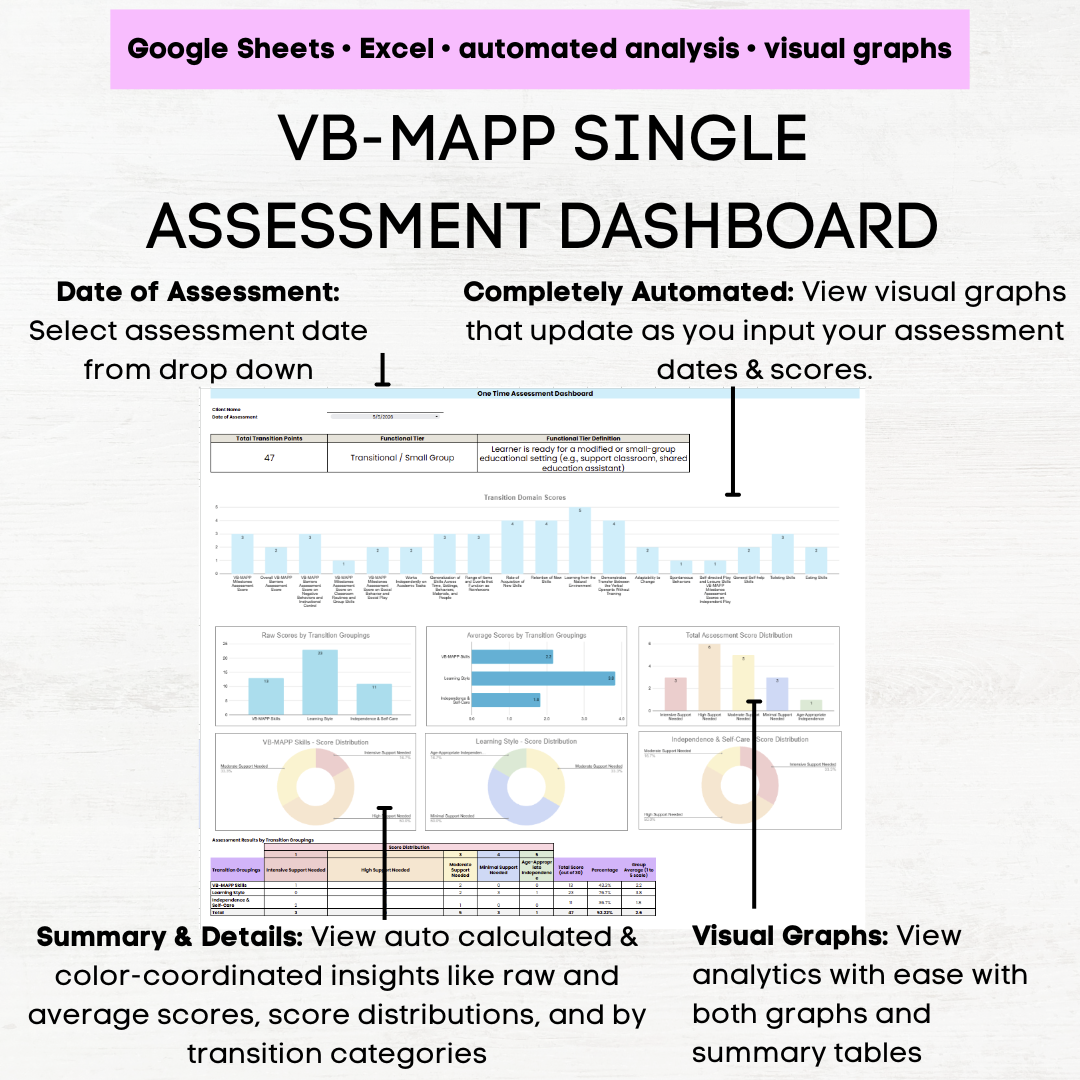 Image 3 of 10
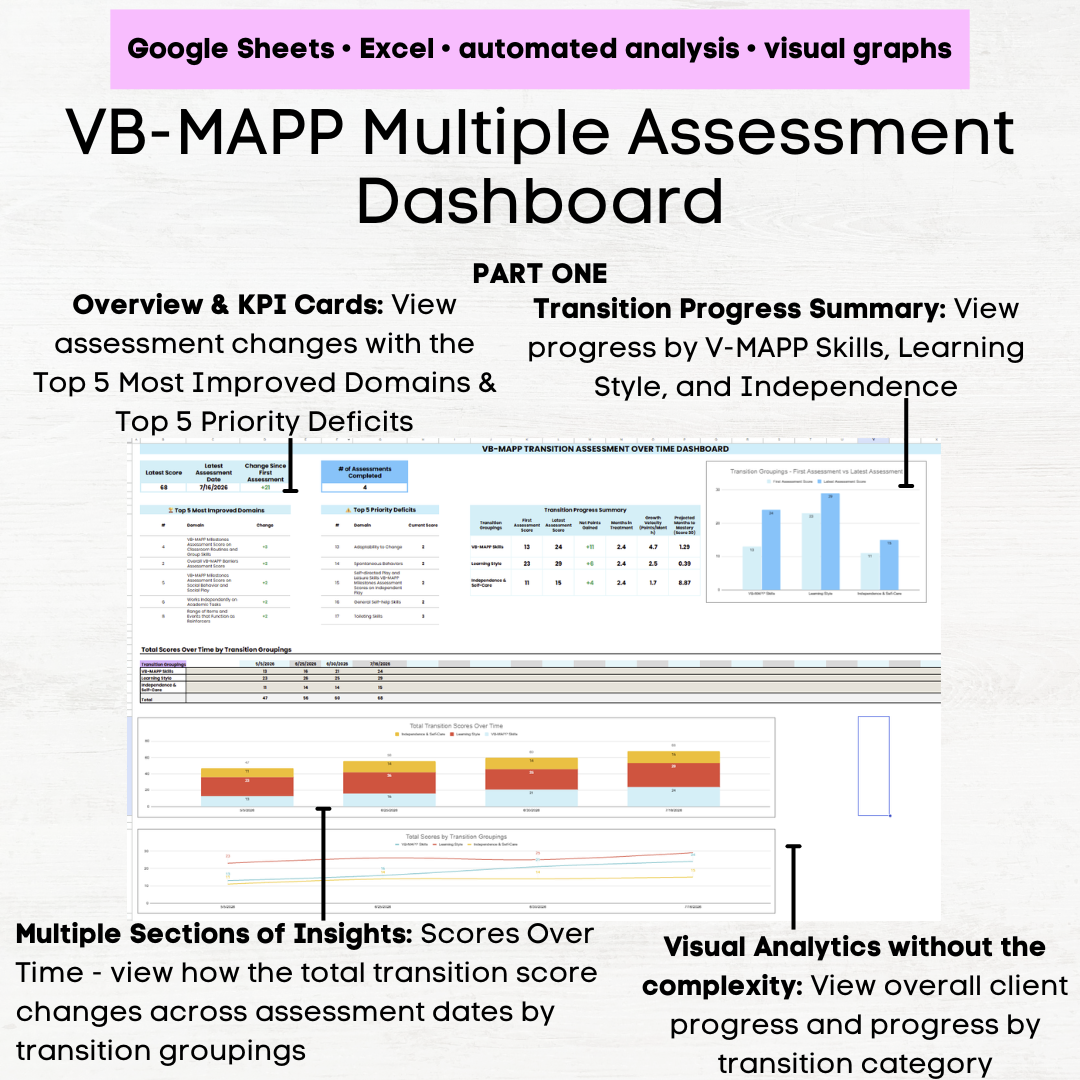 Image 4 of 10
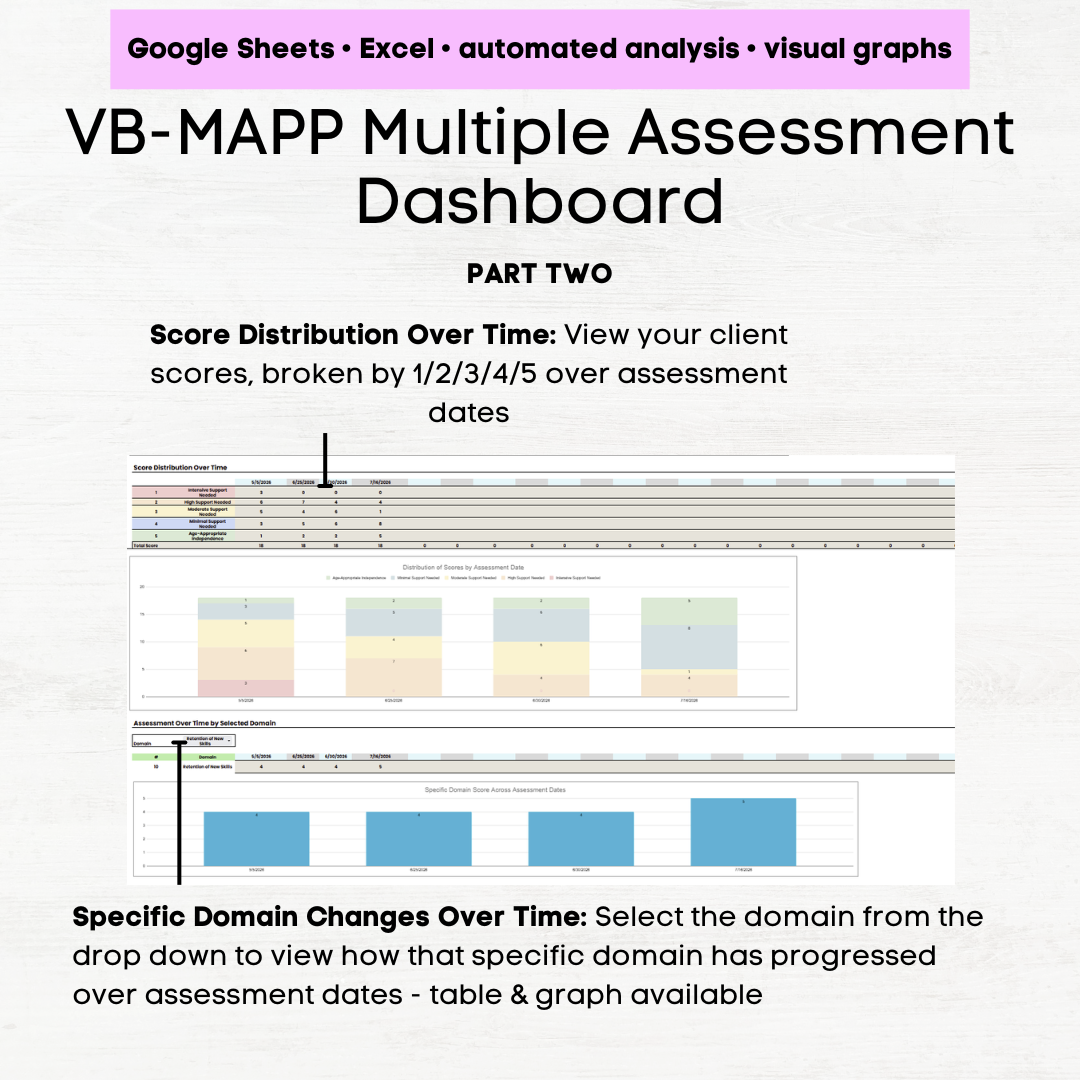 Image 5 of 10
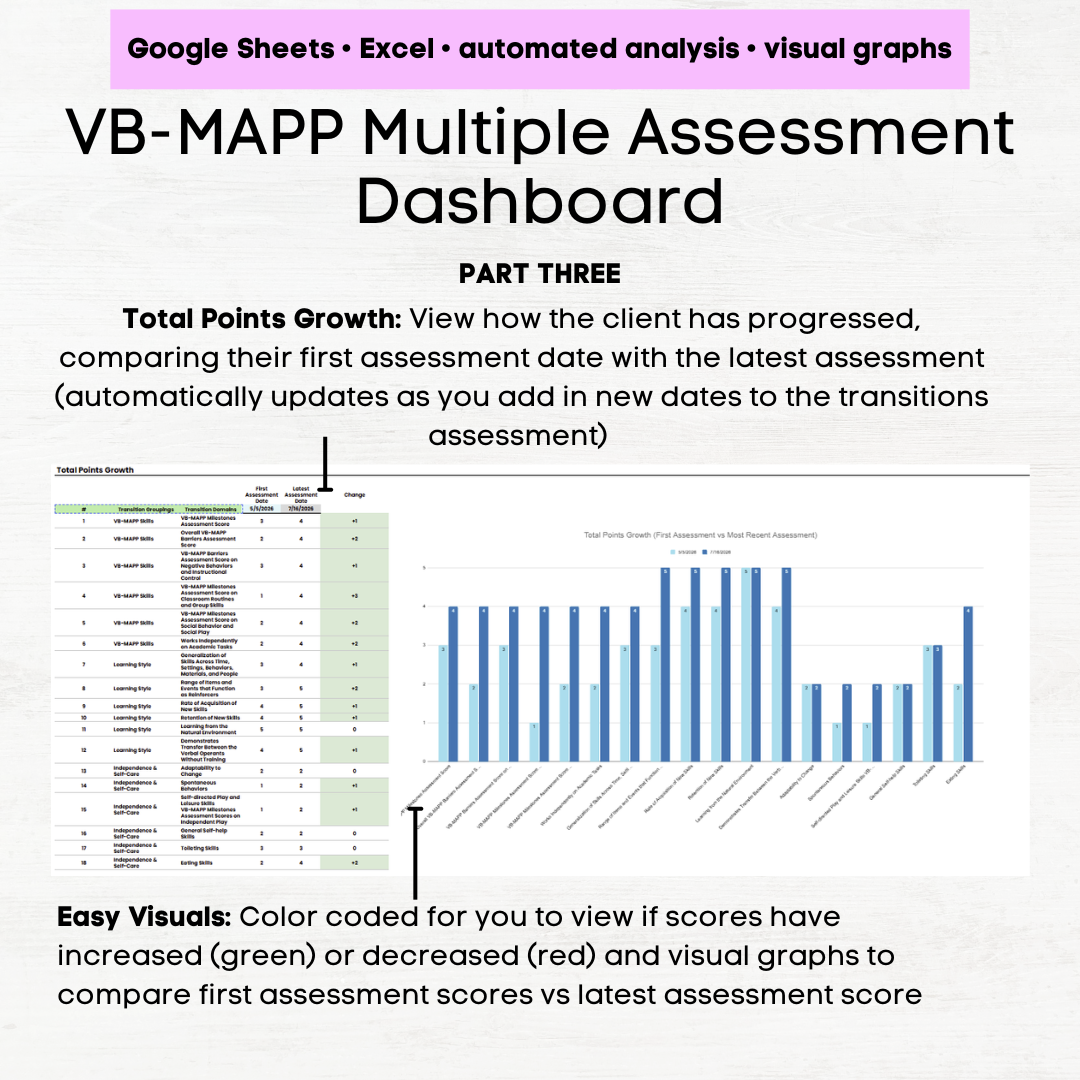 Image 6 of 10
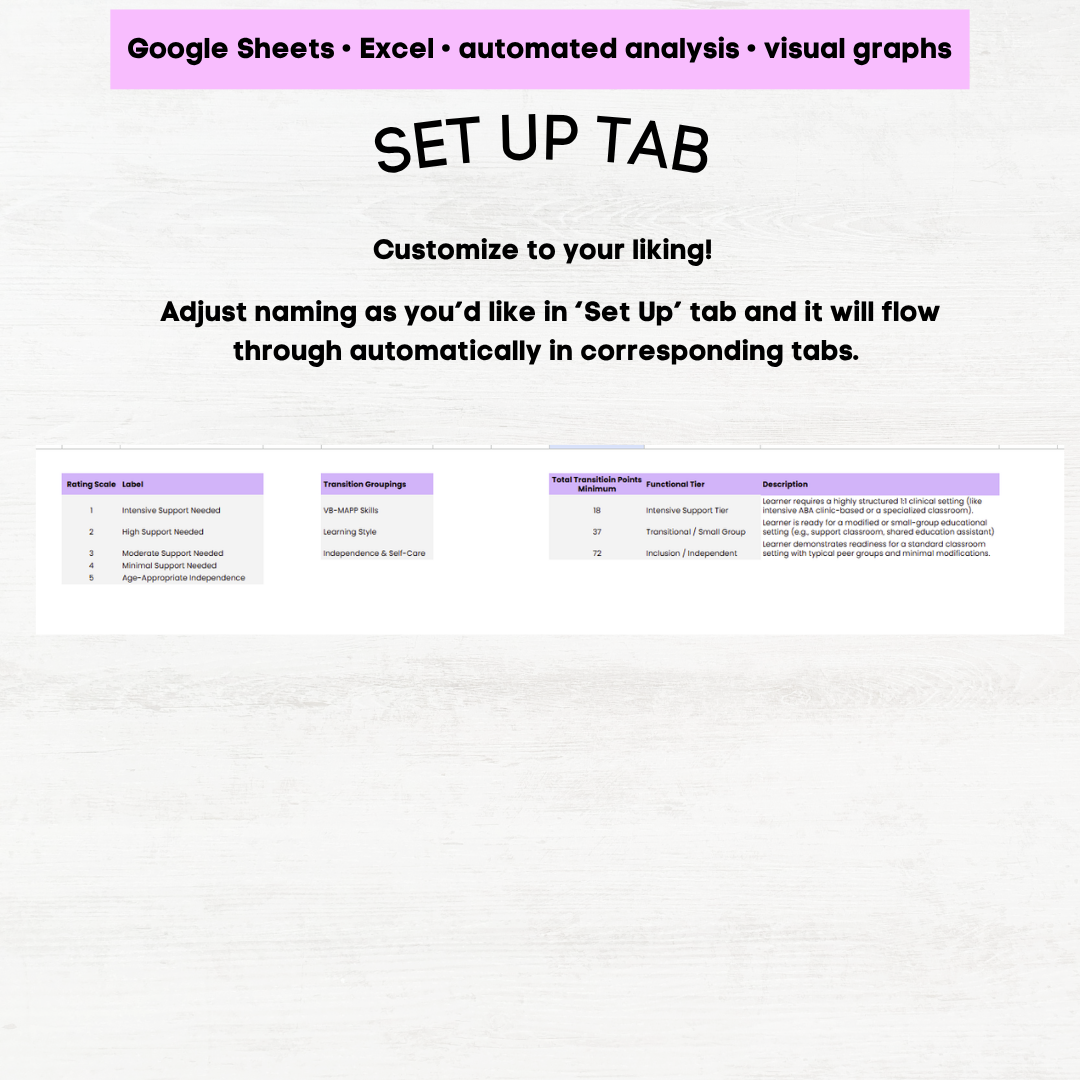 Image 7 of 10
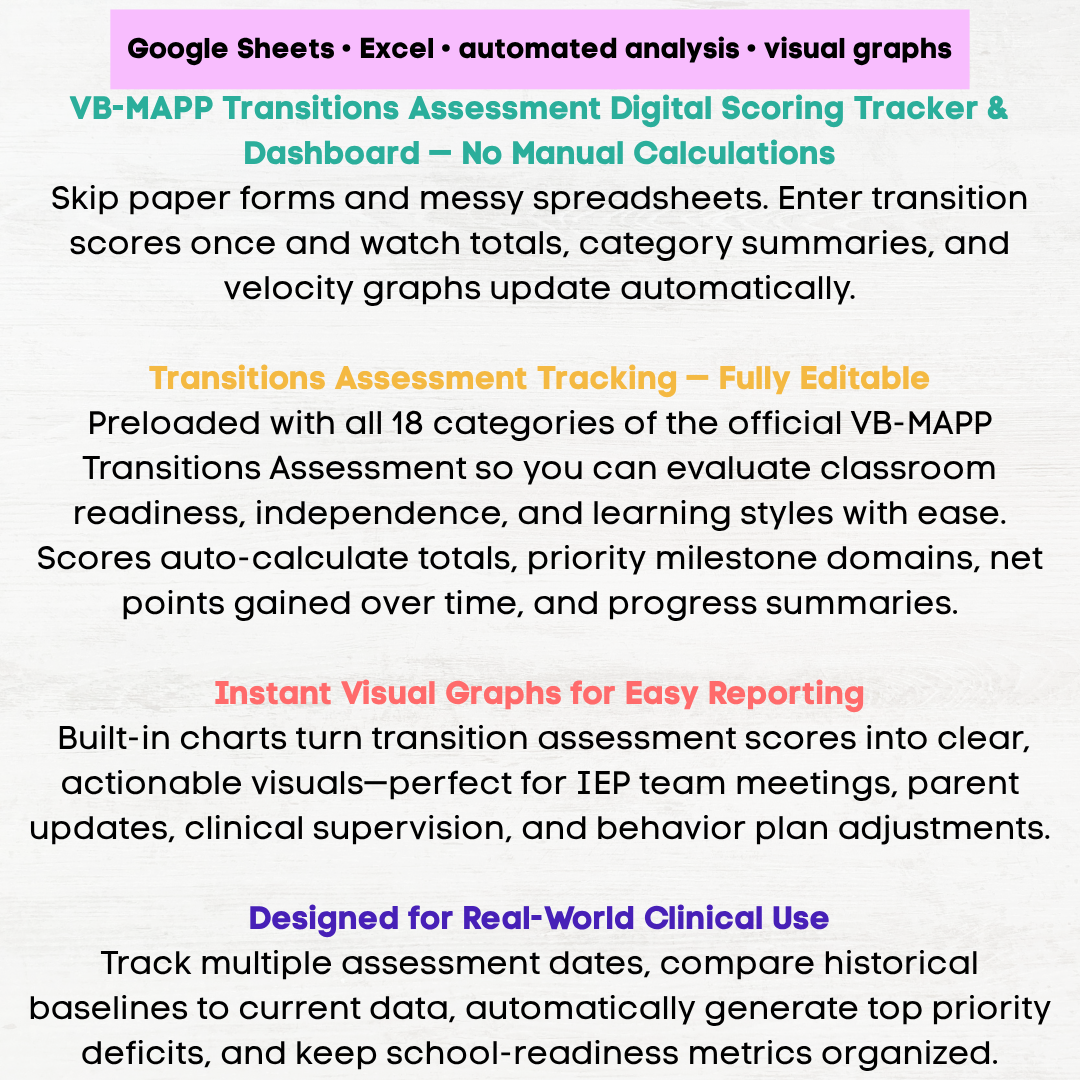 Image 8 of 10
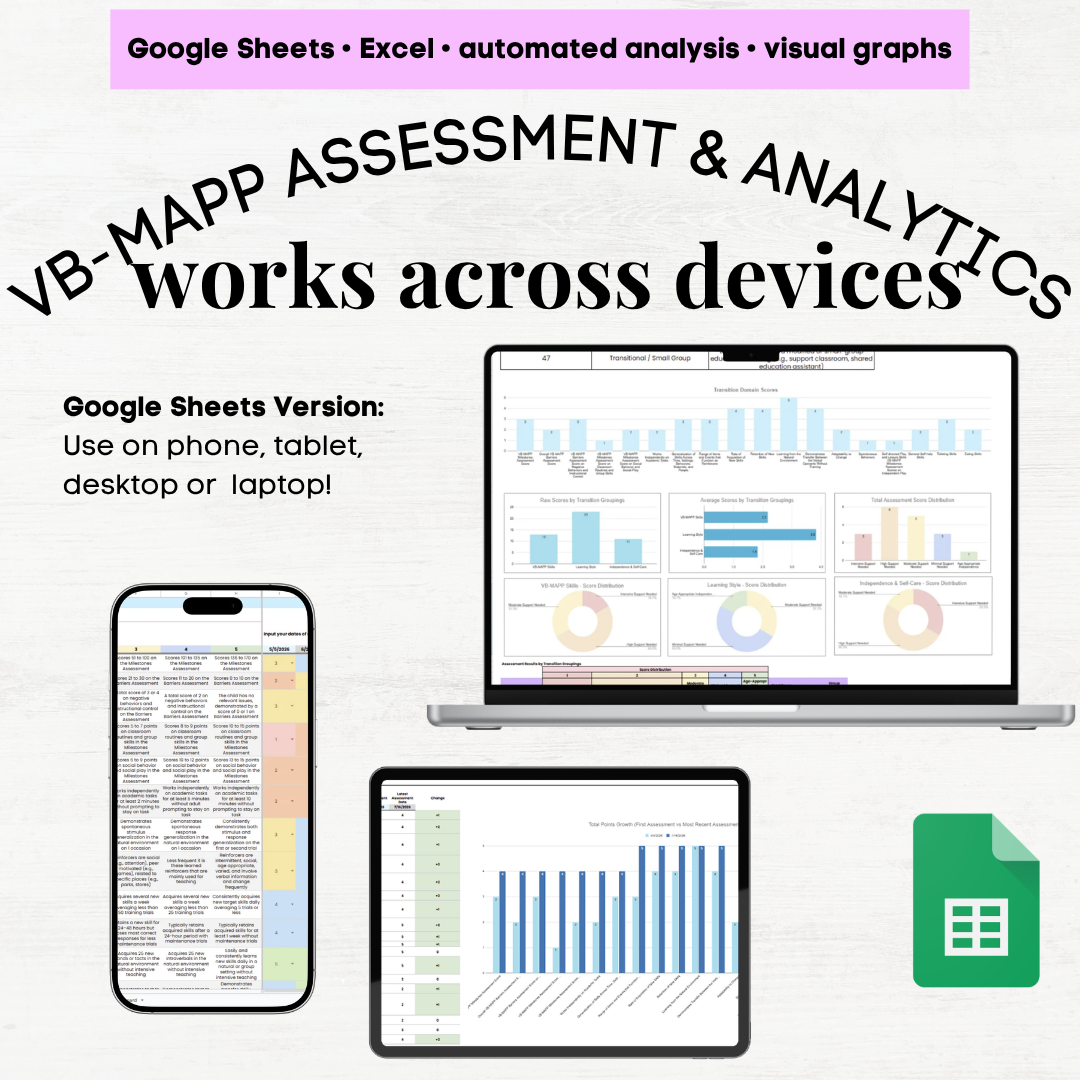 Image 9 of 10
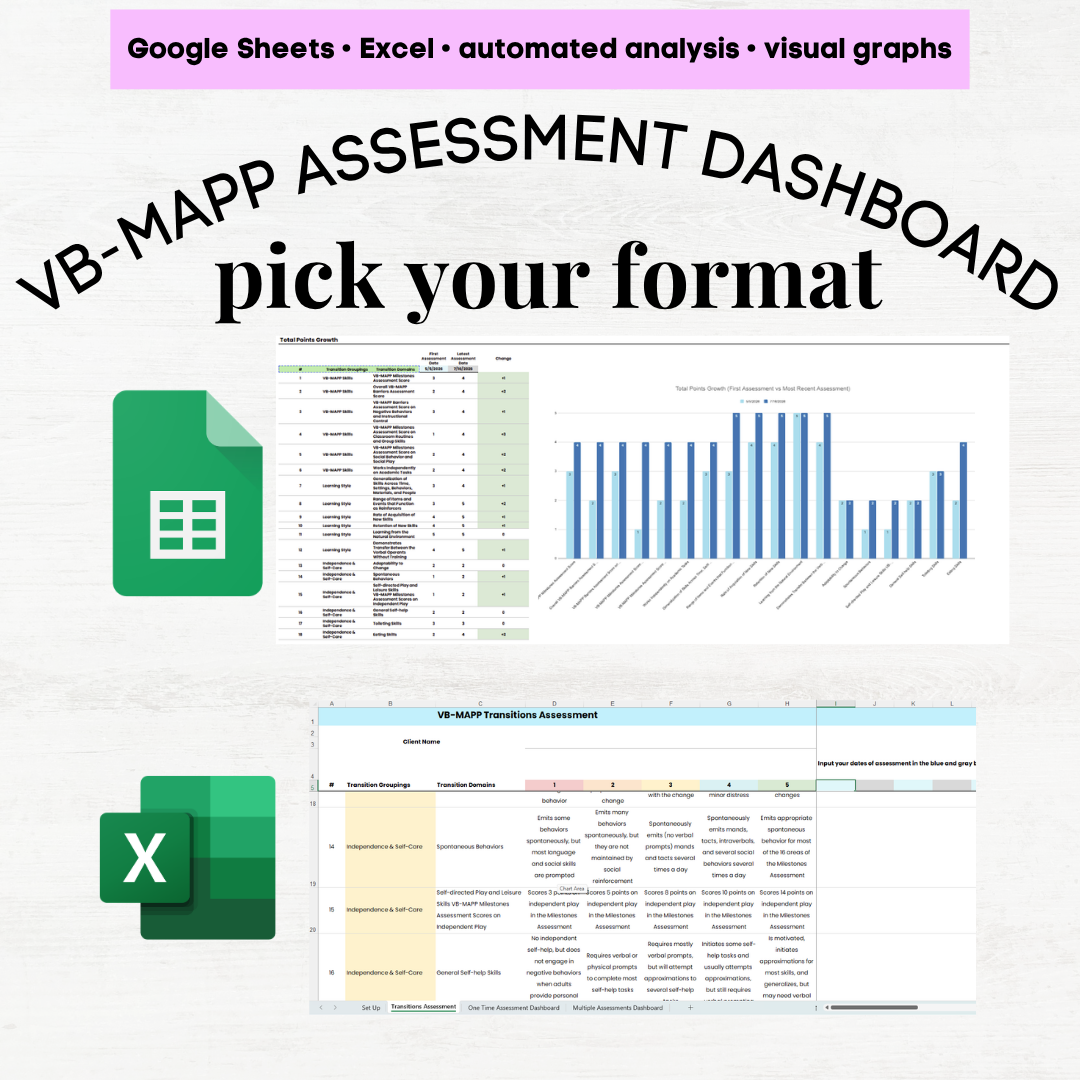 Image 10 of 10