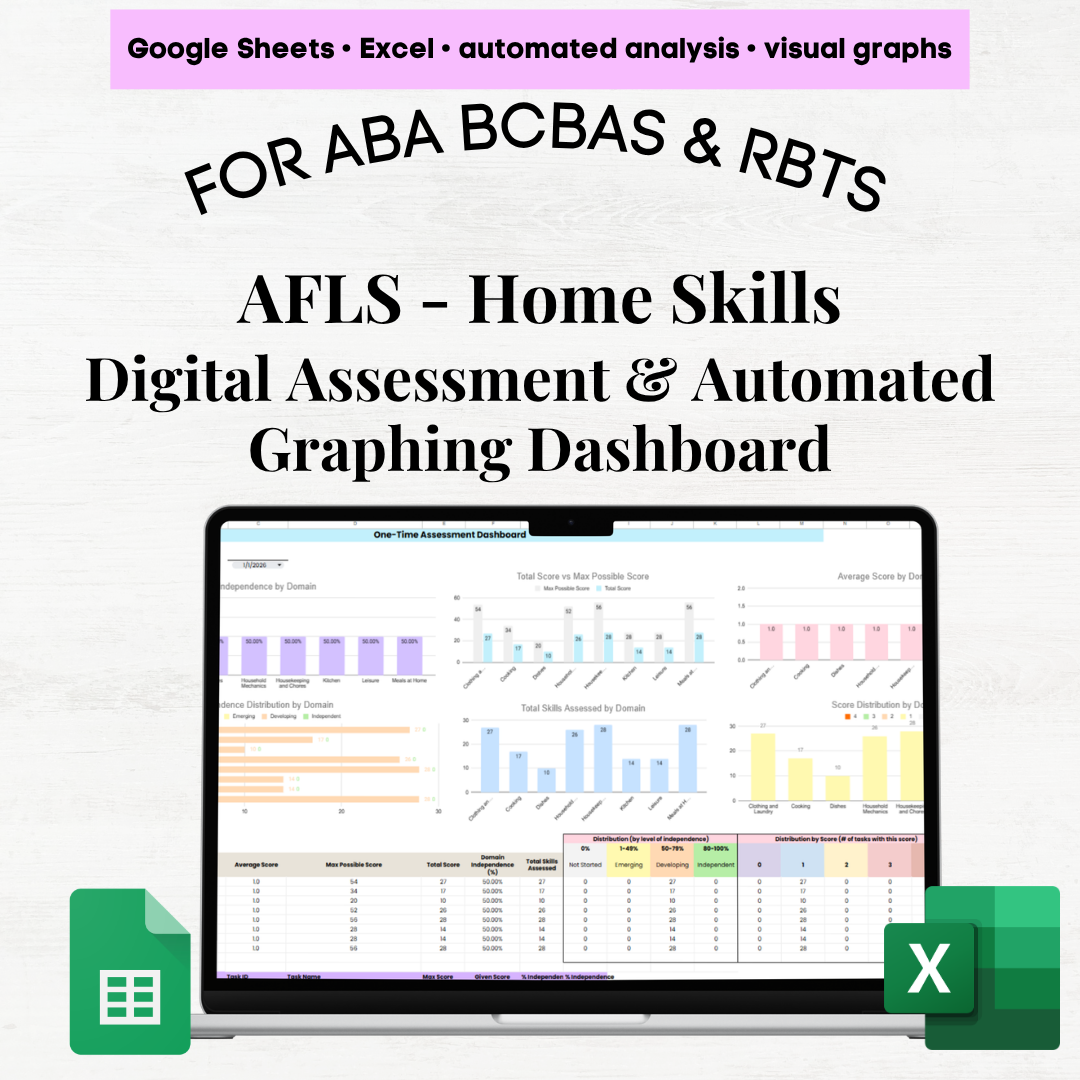
AFLS Community Participation Skills Digital Assessment & Graphing Dashboard (Google Sheets & Excel)
Streamline your Applied Behavior Analysis assessments with this comprehensive AFLS Community Participation Skills digital tracker and automated dashboard. Designed to support efficient data collection and clear visual analysis, this tool includes all 259 AFLS Community Participation Skills tasks and domains, making it a powerful companion for your assessment process.
Important:
This product is intended to be used alongside the official AFLS Guide. It is a supplemental tool for tracking, organizing, and visualizing your data.
📚 Included Domains
🧩 What’s Included (4 Tabs)
1. Set-Up Tab (Customizable)
2. Assessment Tab (Simple Data Entry)
Includes domain, Task ID, task name, and max score
Track up to 25 assessment dates
Use dropdown menus for scoring
📊 3. One-Time Assessment Dashboard (Automated Insights)
Select any assessment date to instantly generate:
% Independence by domain
Total score vs. max score
Average score by domain
Independence distribution (Not Started → Independent)
Total skills assessed
Score distribution (0, 1, 2, etc.)
Includes detailed summaries:
Domain-level overview (scores, %, distributions)
Task-level breakdown (Task ID, score, % independence)
📈 4. Multiple Assessment Dashboard (Track Progress Over Time)
Also includes:
Individual task progress tracking
Summary tables (avg score, % independence, total tasks)
Domain performance comparison over time
Task volume visuals:
✨ Key Features
Fully automated calculations & graphs
Compatible with Google Sheets & Excel
Built-in scoring controls to reduce errors
Clear visuals for quick insights
Saves time and supports data-driven decisions
Perfect for practitioners who want to stay organized, track progress clearly, and make confident, data-informed decisions.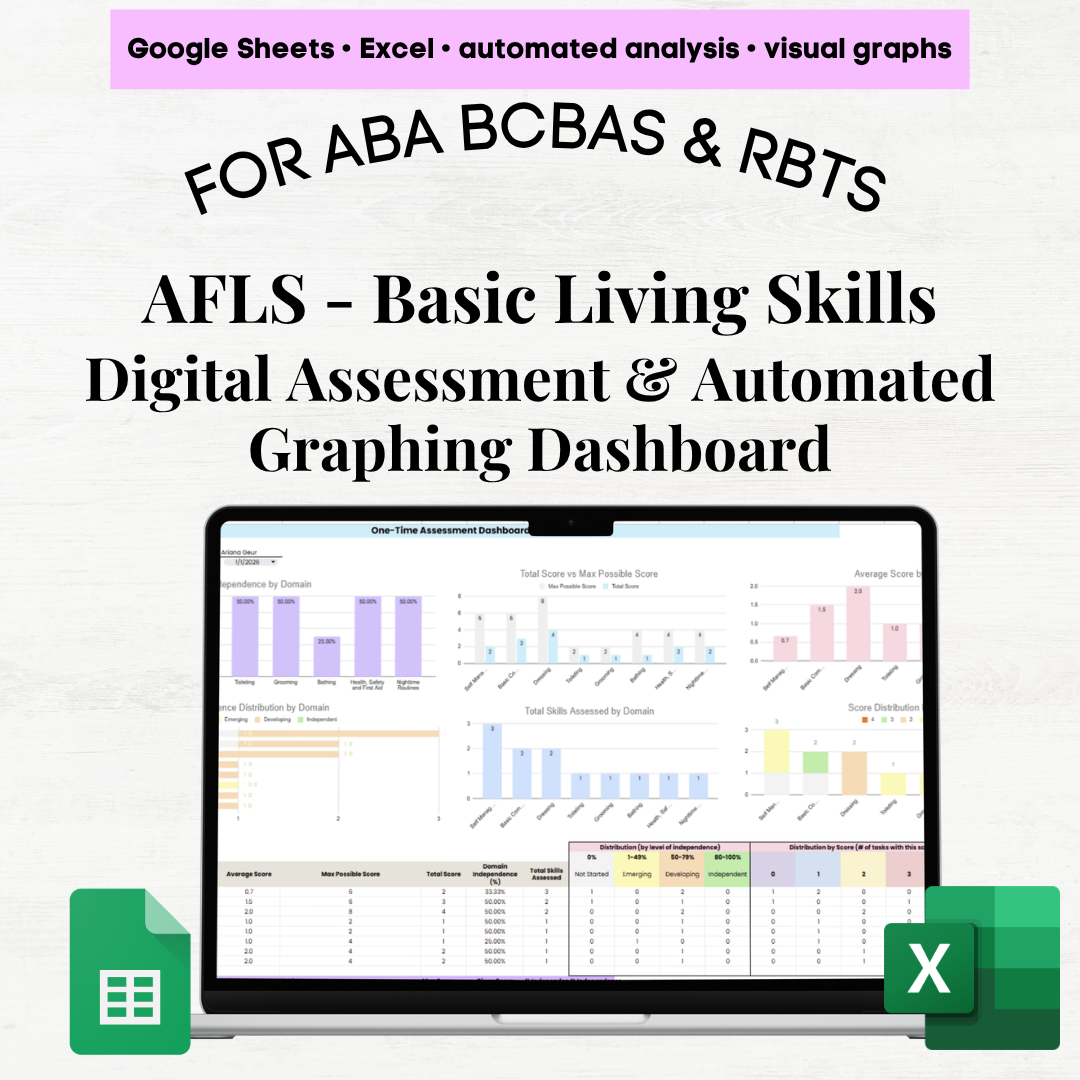

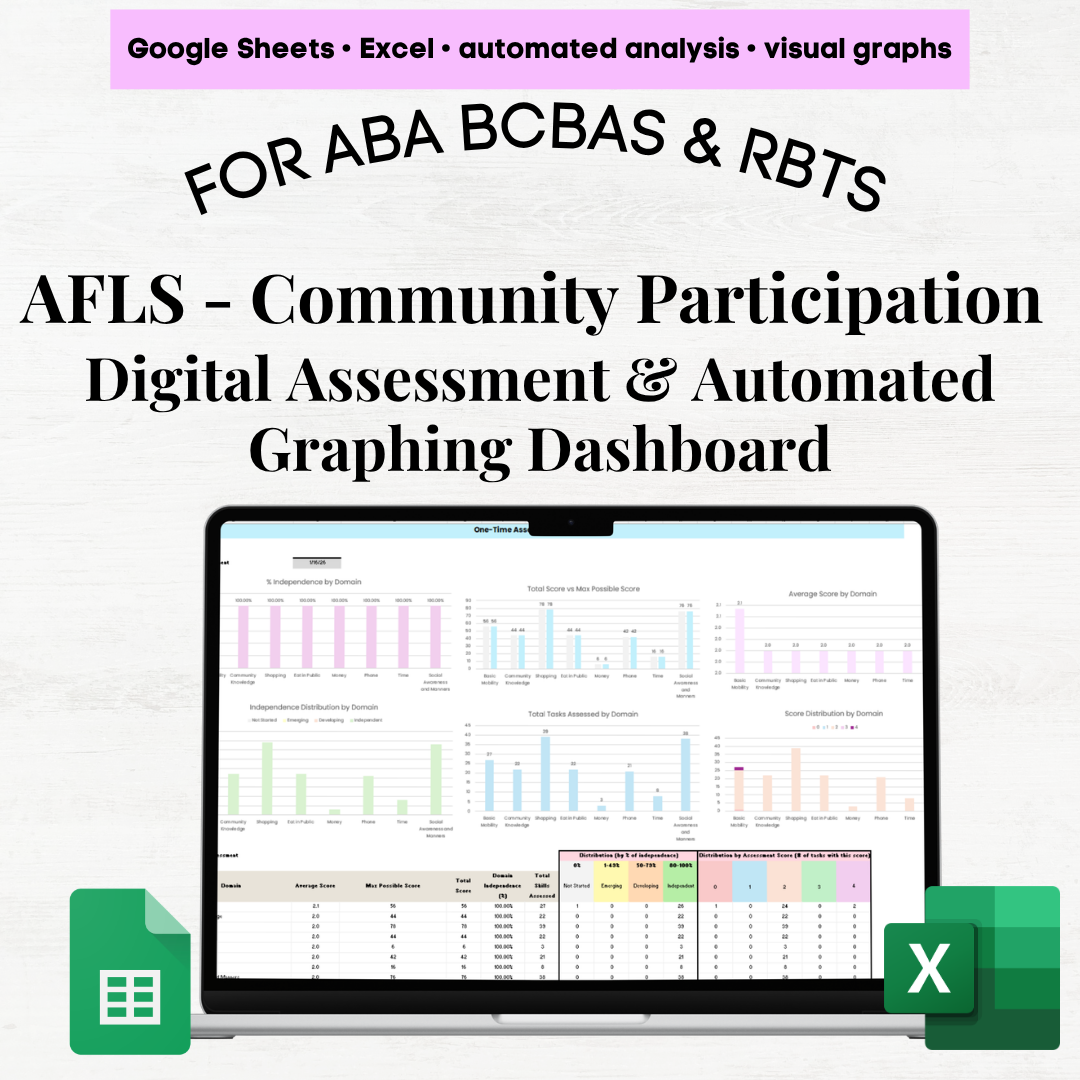 Image 1 of 11
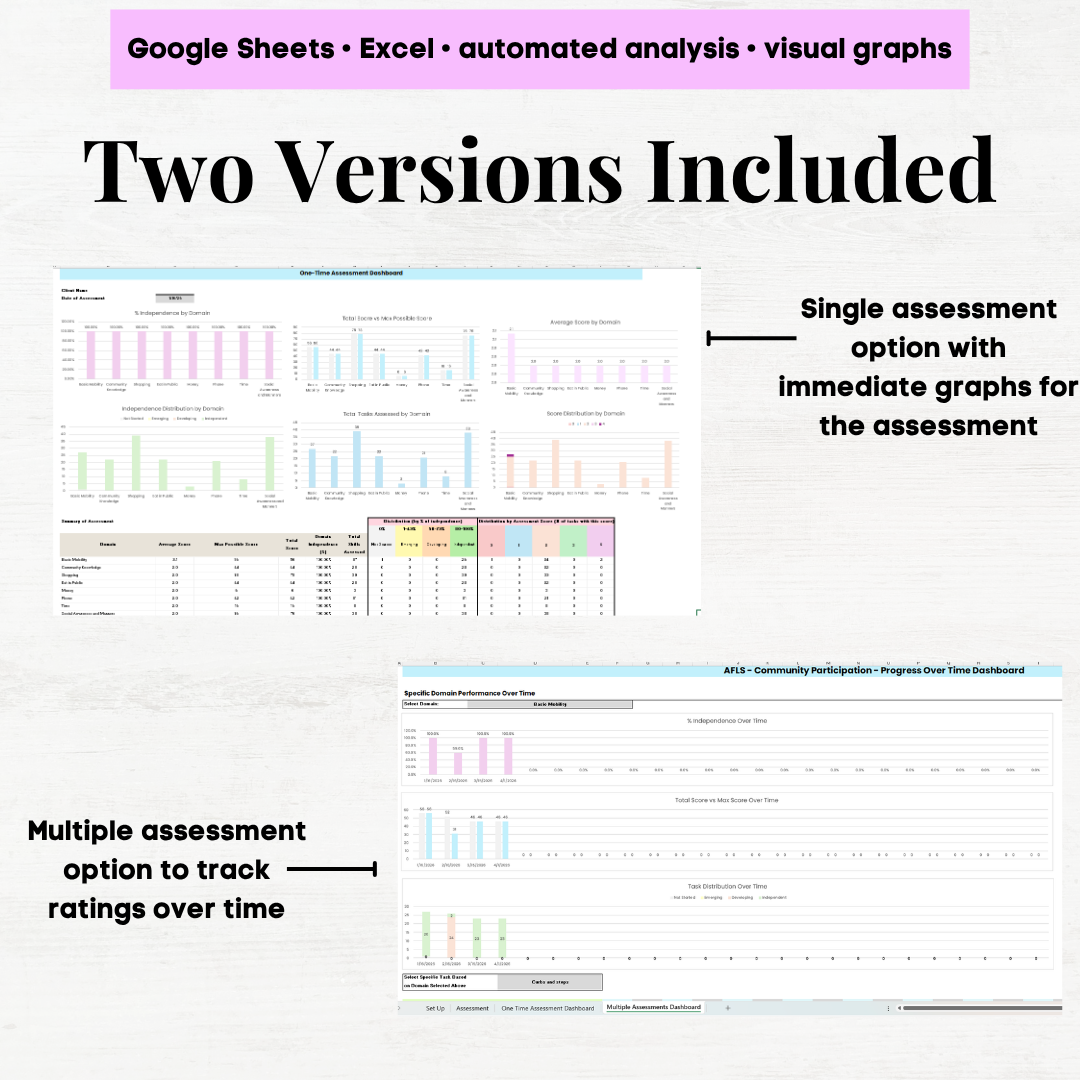 Image 2 of 11
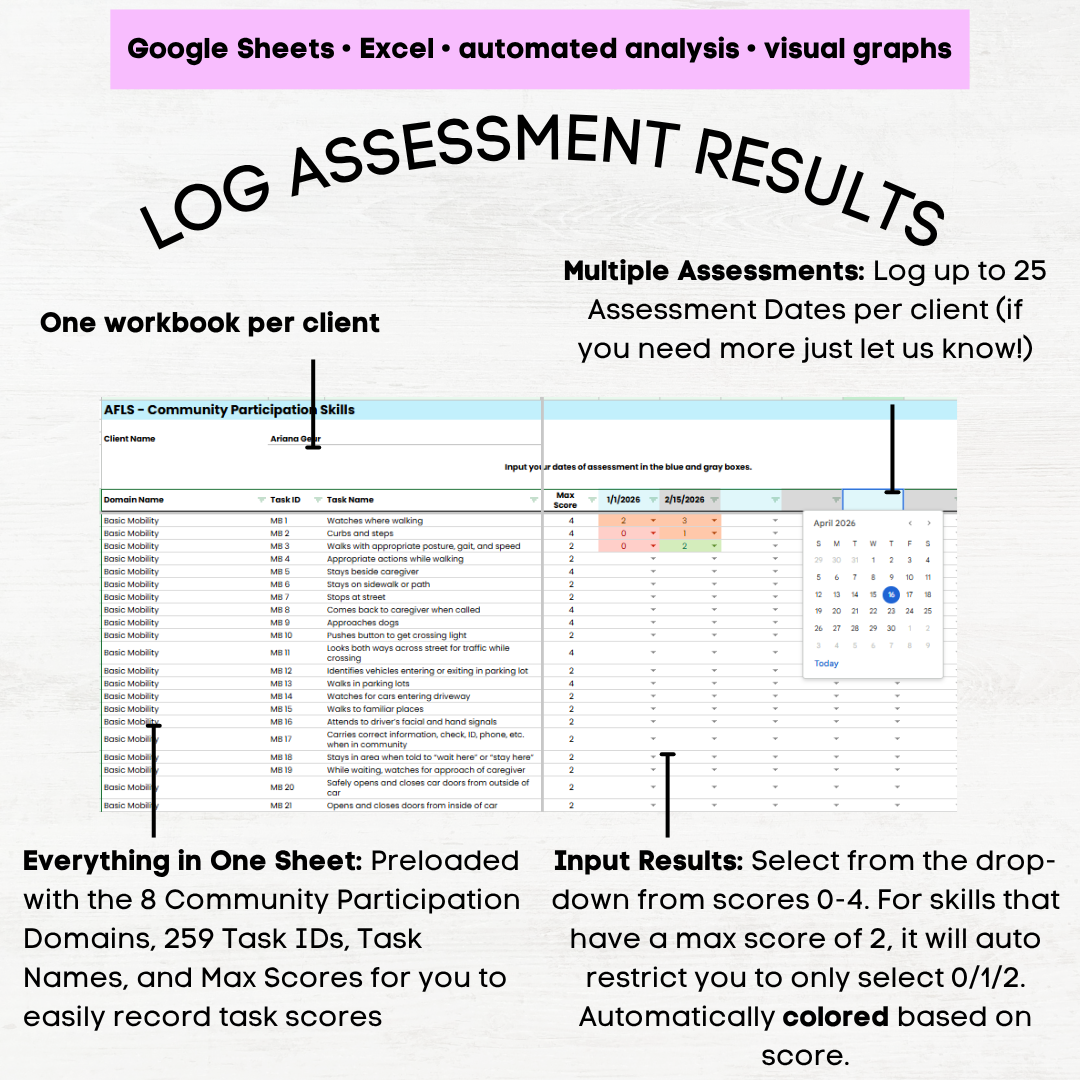 Image 3 of 11
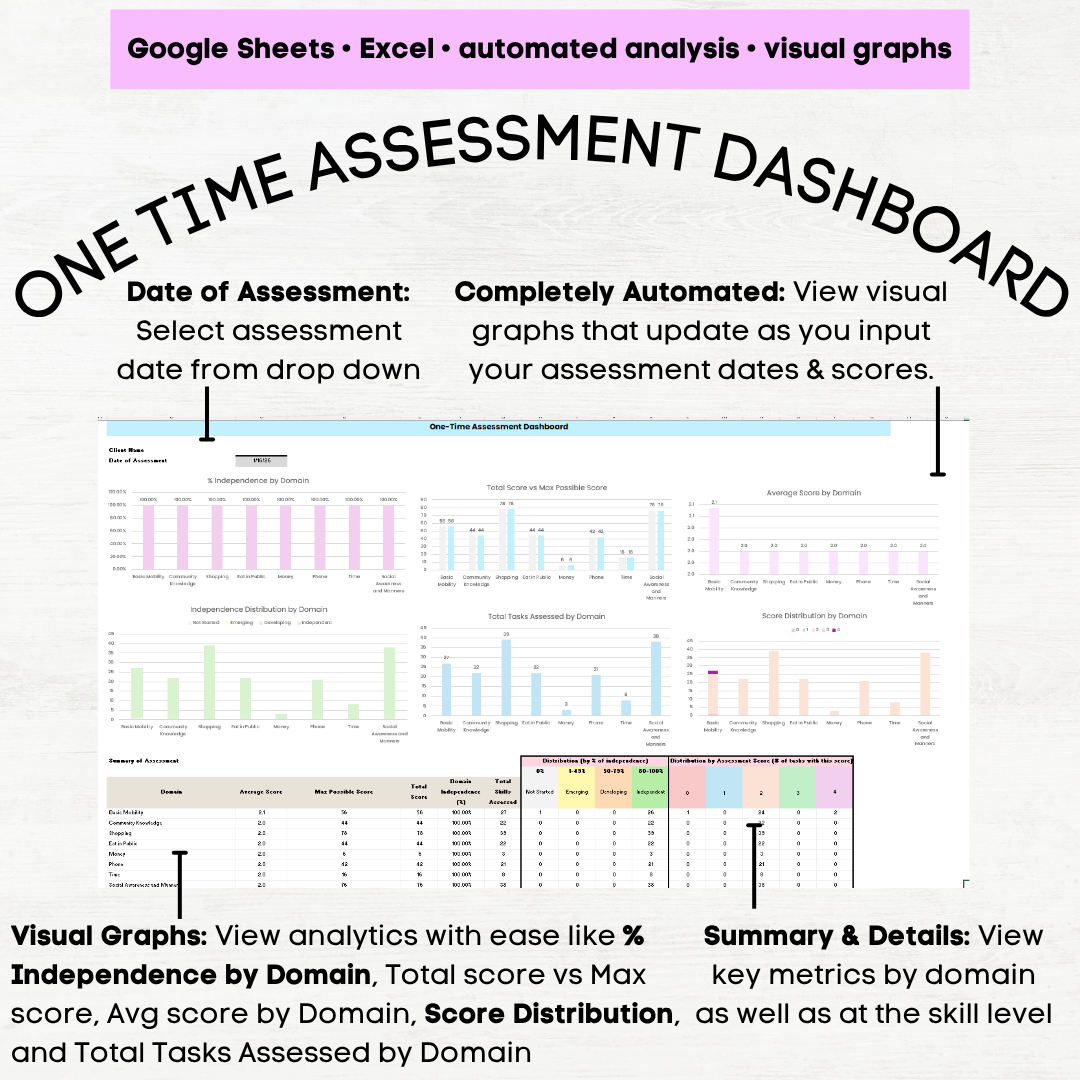 Image 4 of 11
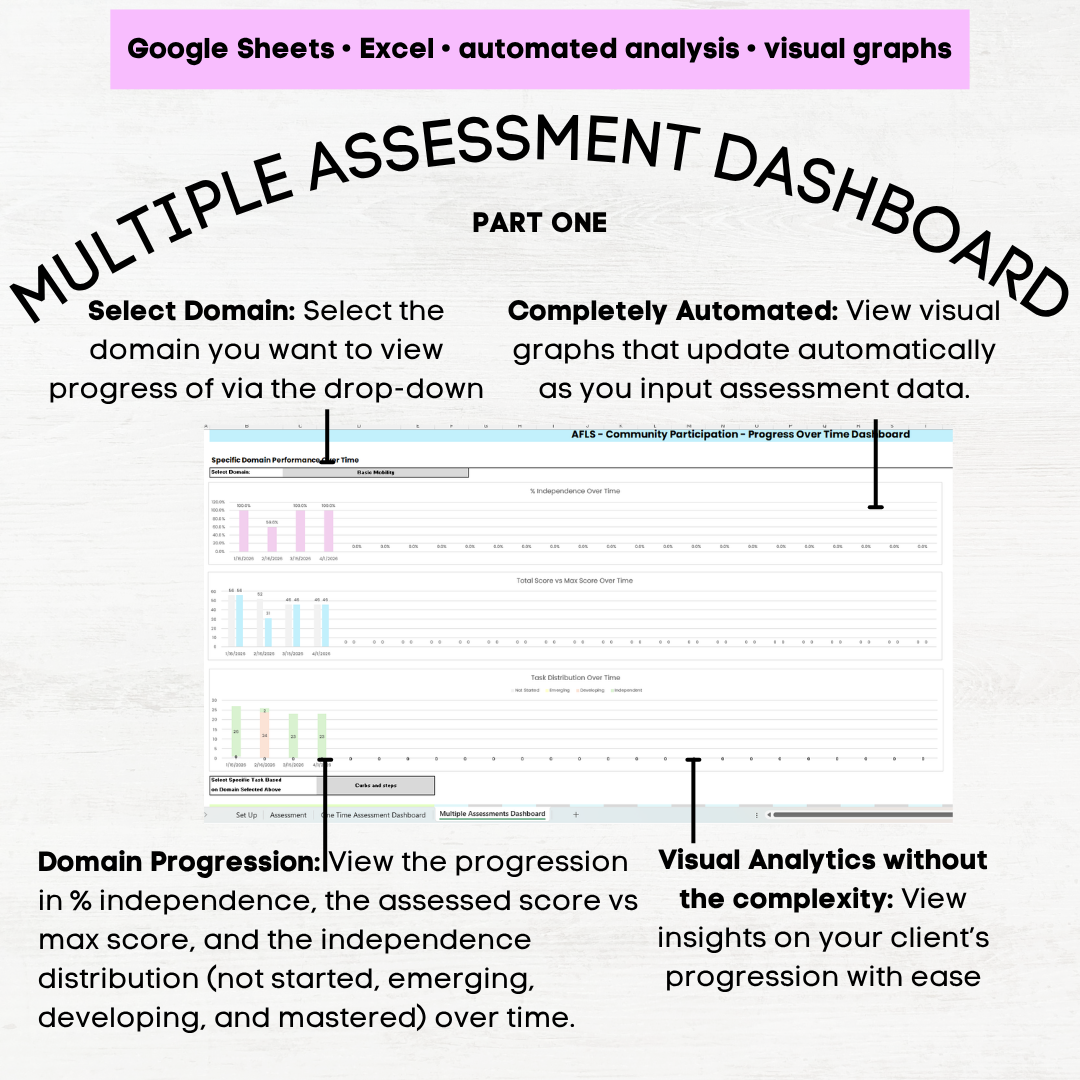 Image 5 of 11
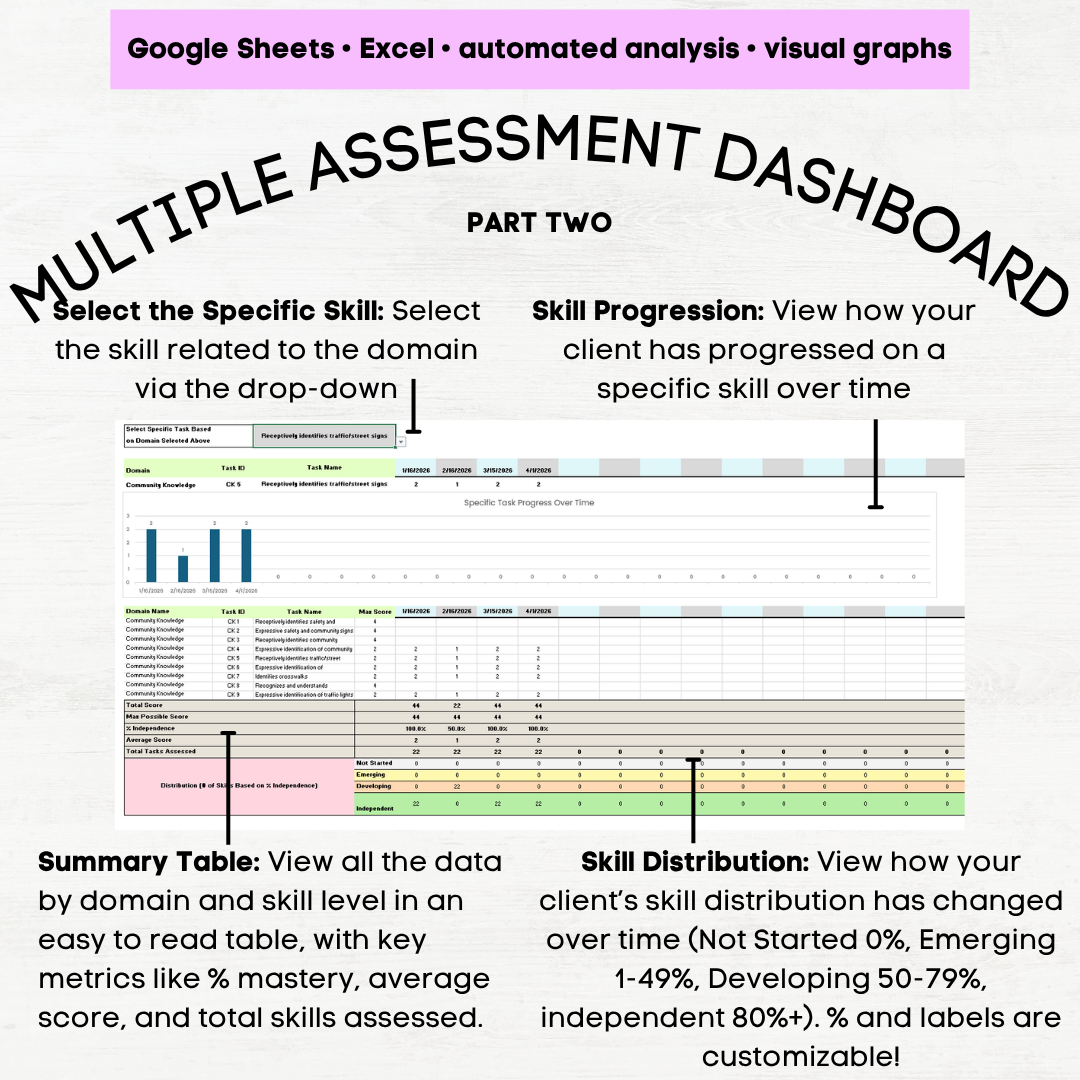 Image 6 of 11
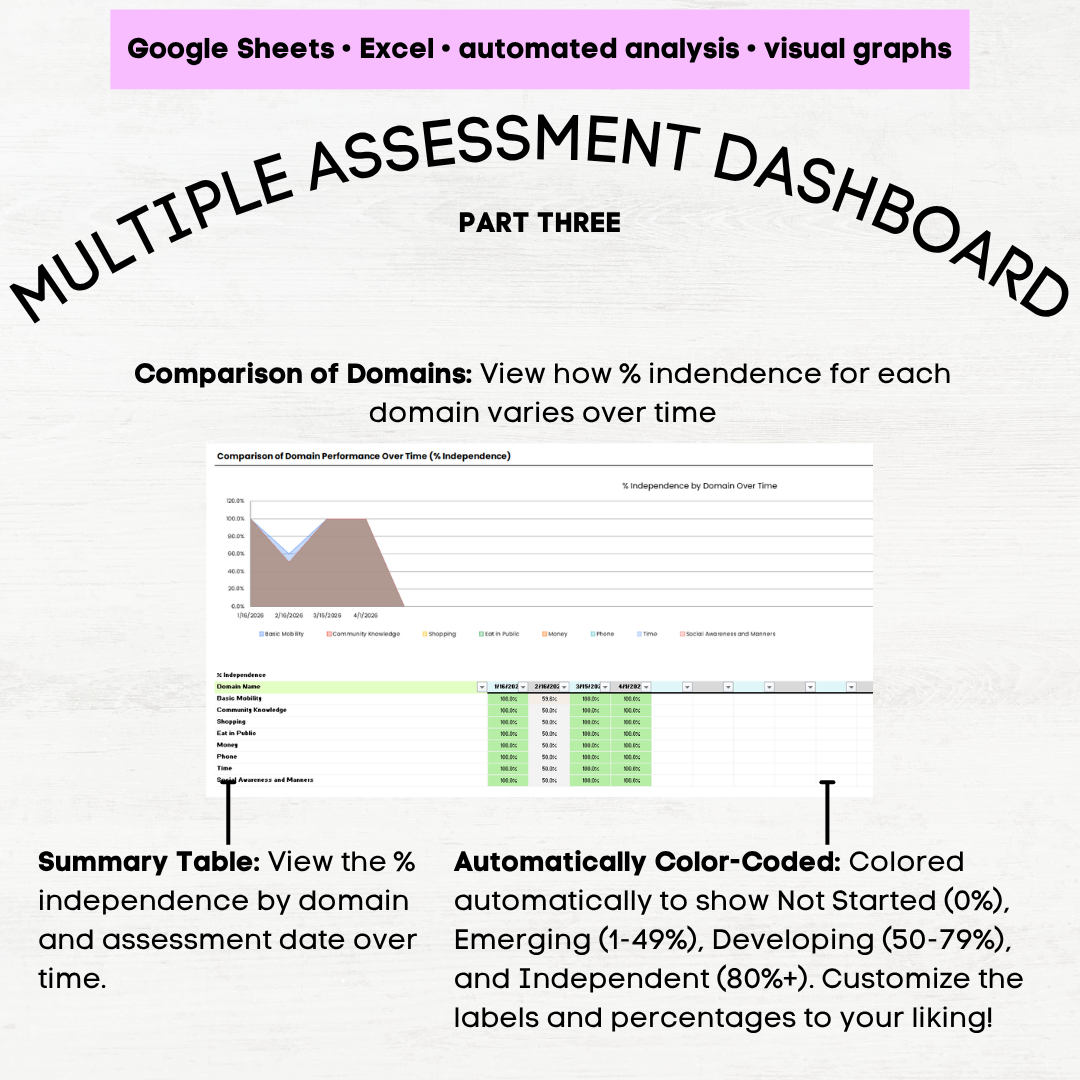 Image 7 of 11
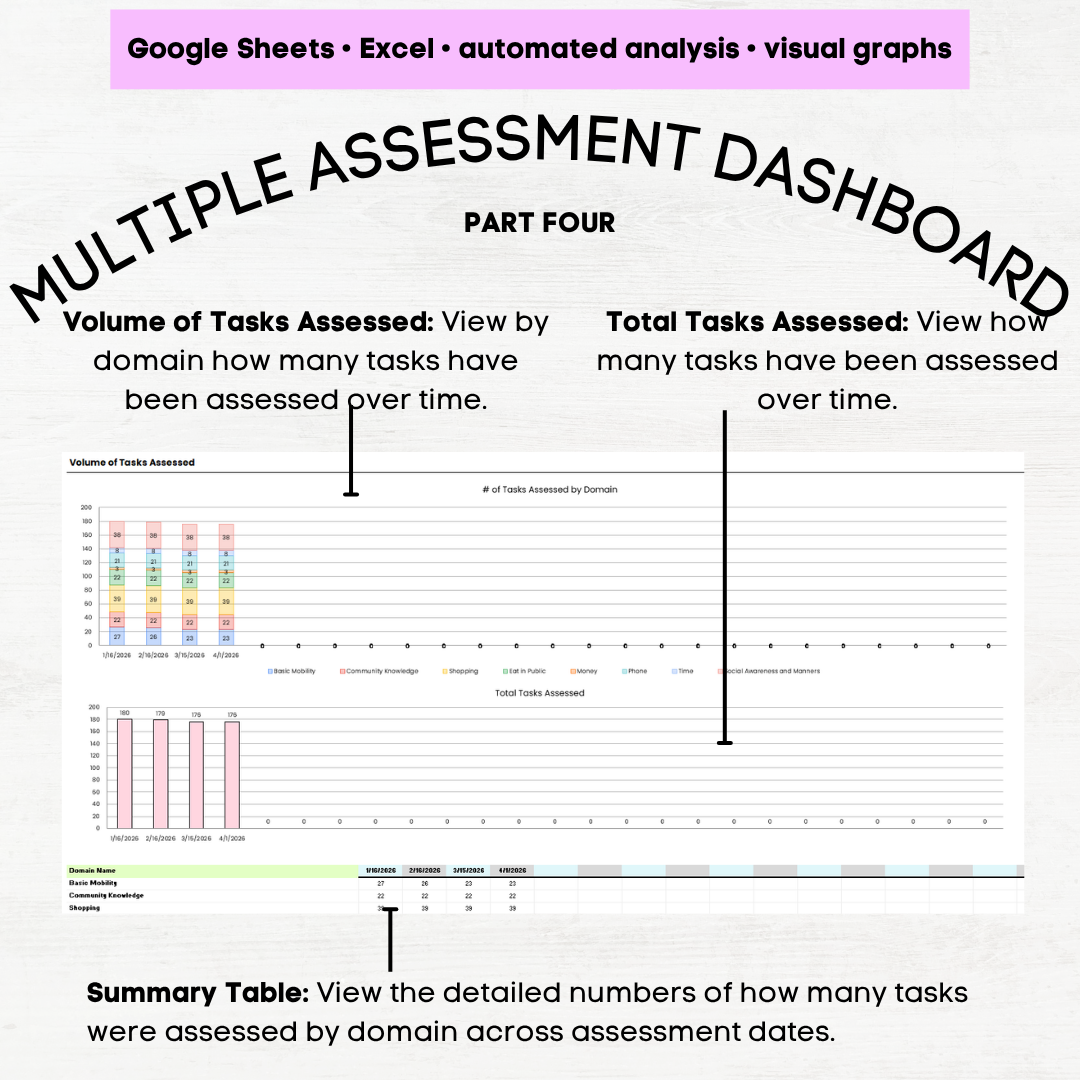 Image 8 of 11
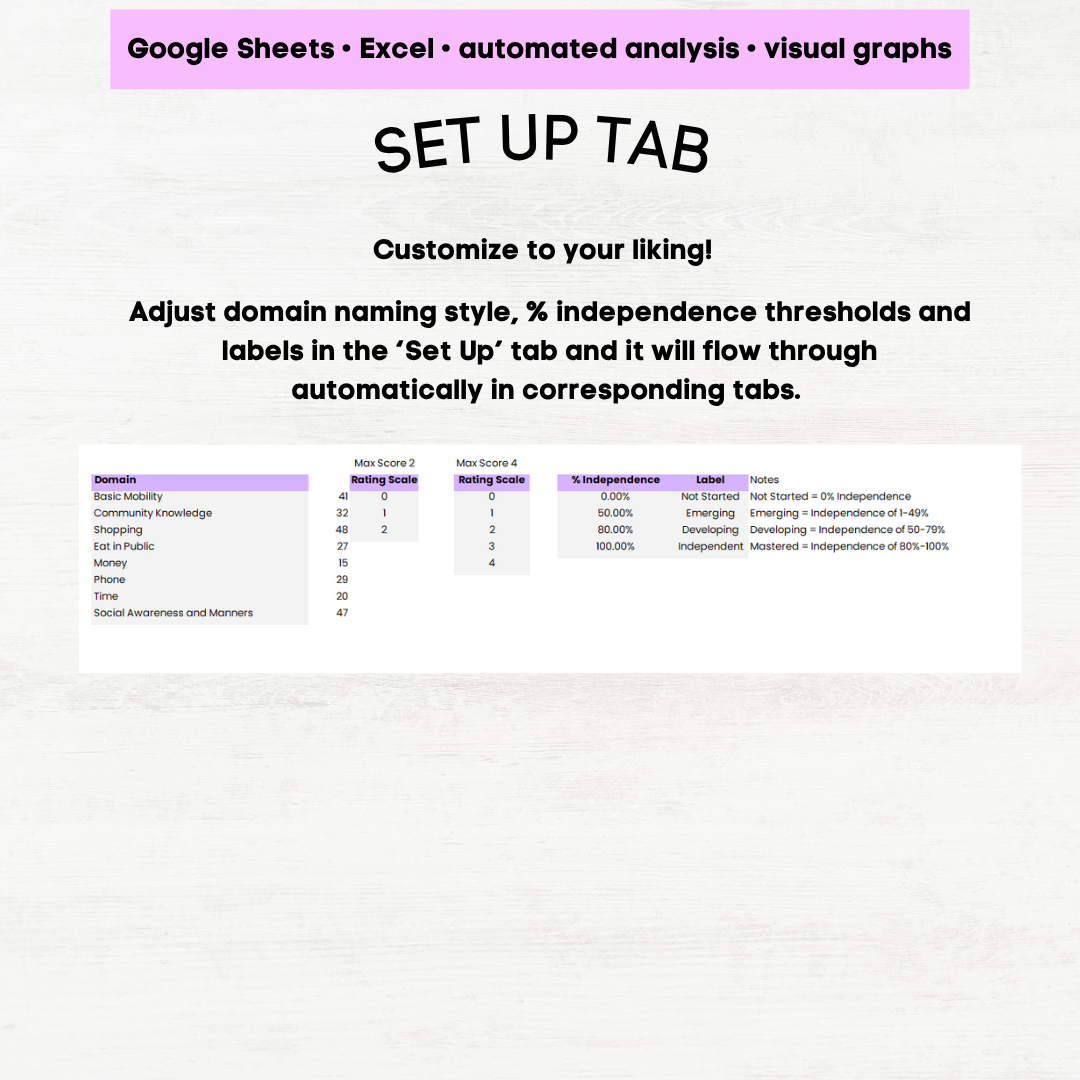 Image 9 of 11
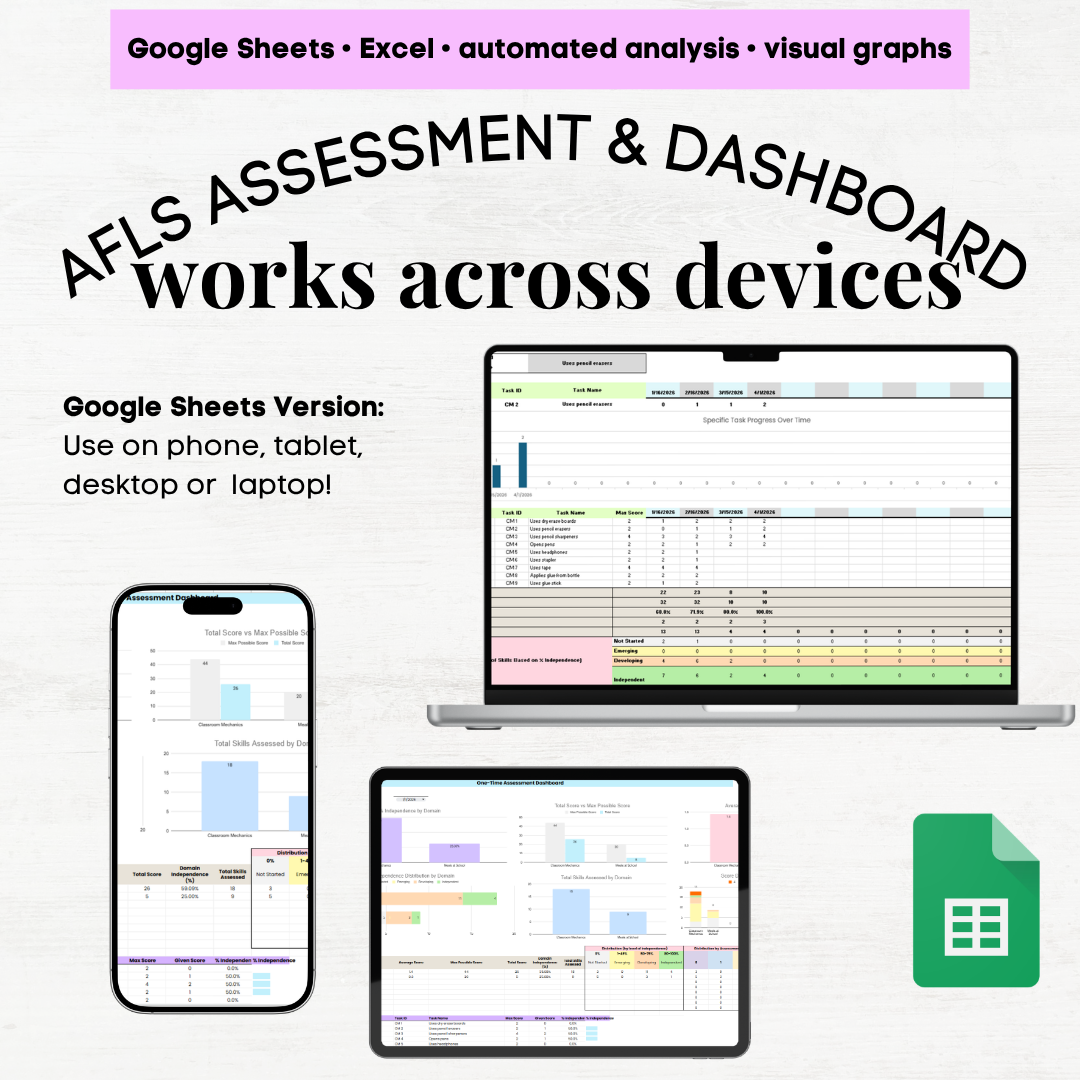 Image 10 of 11
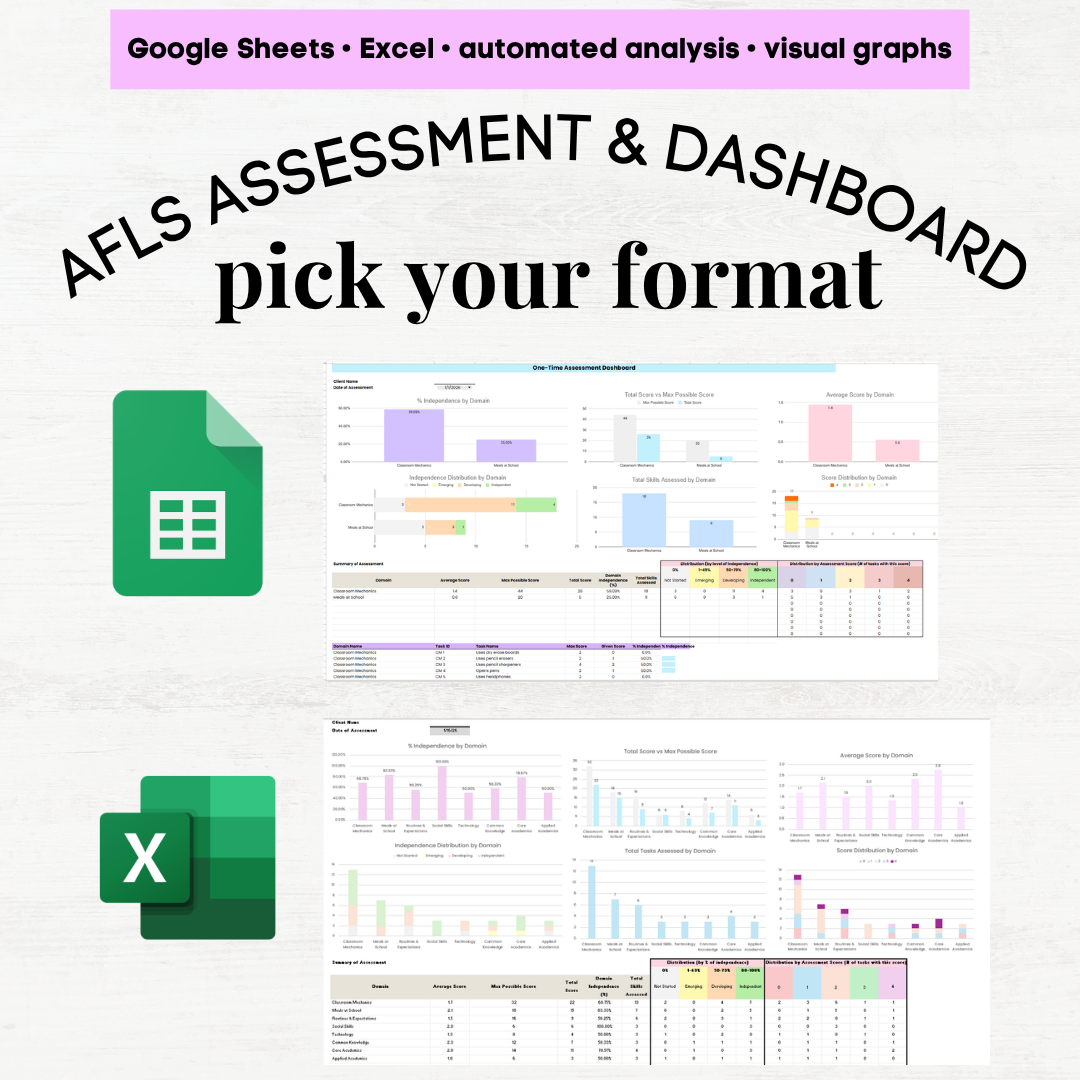 Image 11 of 11